ROUTING LAB · RUST + WEBGL
Pathfinder 3D
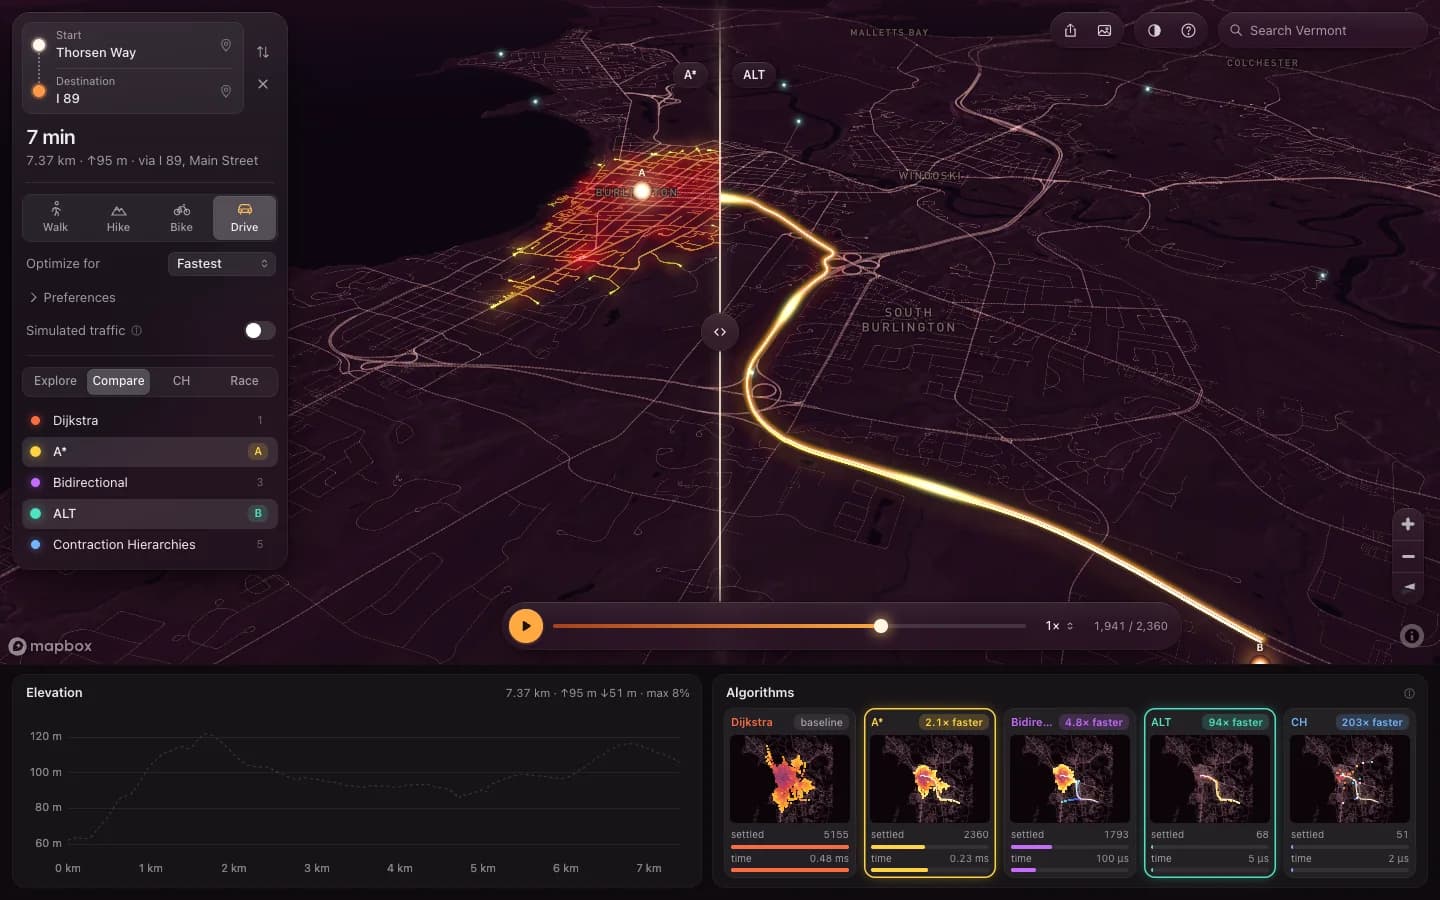
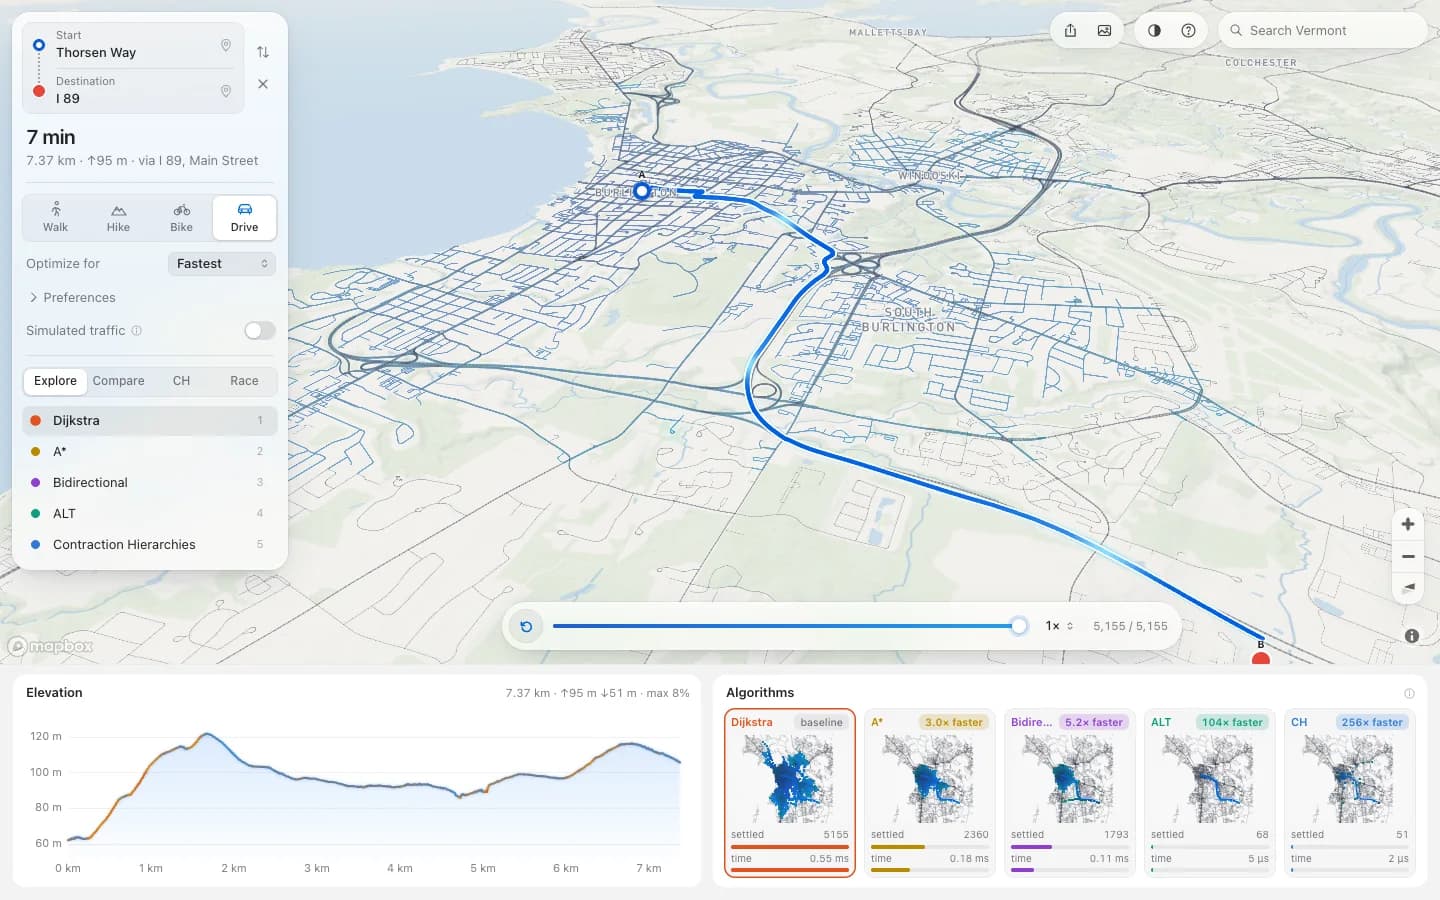
Every map app gives you the answer and throws the search away. This one keeps the search: drop two pins anywhere in Vermont and watch Dijkstra settle 5,155 nodes to find a seven minute drive that Contraction Hierarchies finds by looking at 51. The five algorithms, the binary heap underneath them and the tile format they read are all written from scratch in Rust and compiled to WebAssembly, with no routing crate, no graph crate and no wasm-bindgen anywhere in it.
Open Pathfinder 3D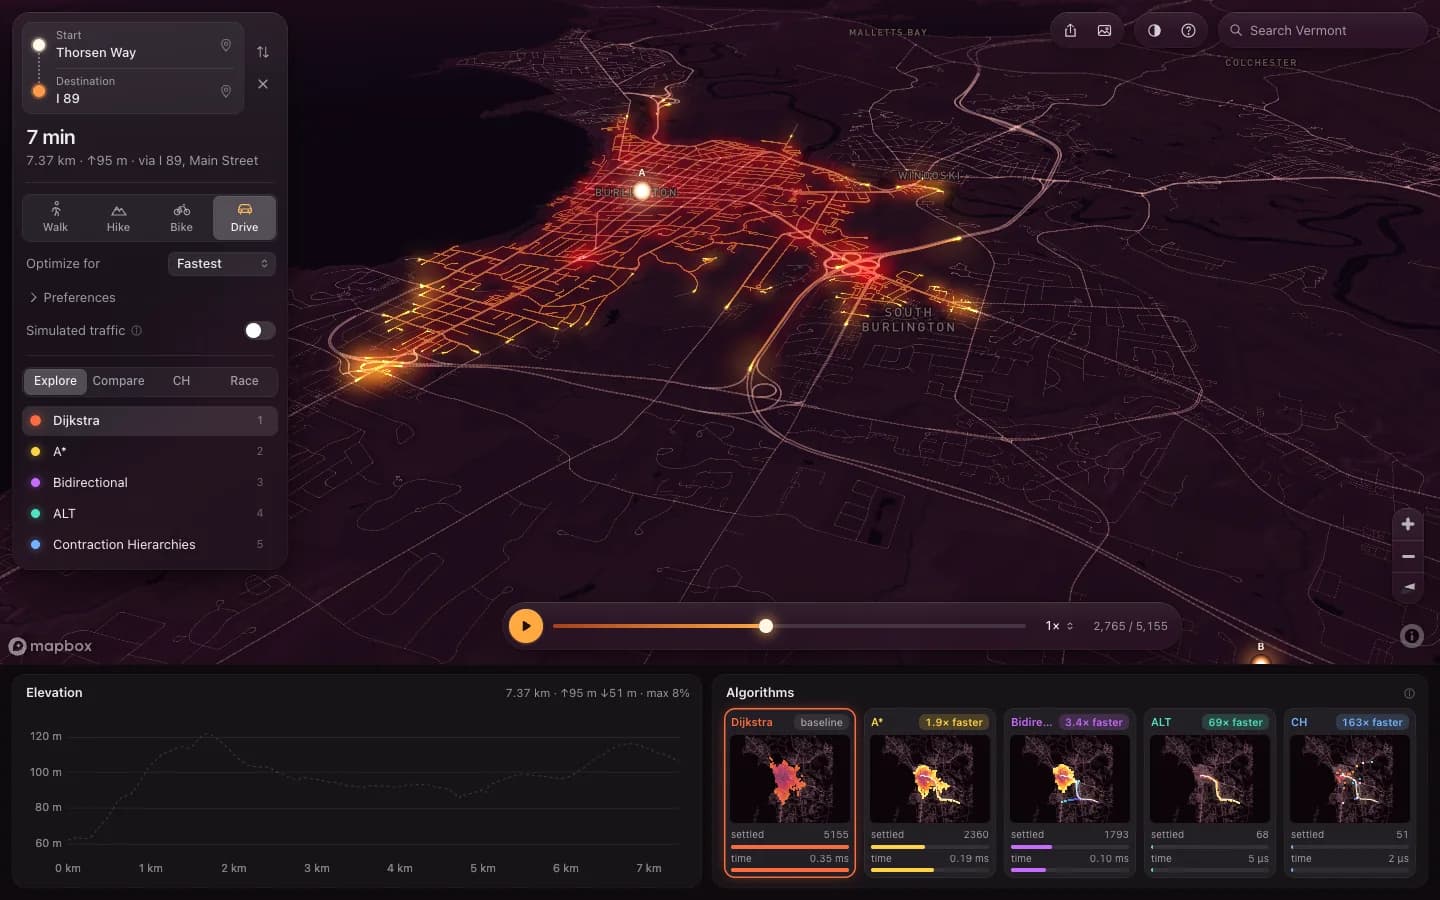
- 5
- shortest-path algorithms written from scratch in Rust
- 222k
- graph nodes, stitched from tiles while you move
- 2,611×
- Contraction Hierarchies over Dijkstra on a 245 km query
- 72
- tests across Rust, the wasm wrapper, the pipeline and the browser
The graph size is read from the tile build’s own manifest for data version vt-2026-10-22. The test count is 19 Rust, 22 routing, 17 pipeline and 14 Playwright, each behind one npm script. The speed-up compares two of these algorithms on the same query, as untraced medians in the browser on one laptop, and is not a comparison with any other routing engine.
RUN IT YOURSELF
Pathfinder 3D, here
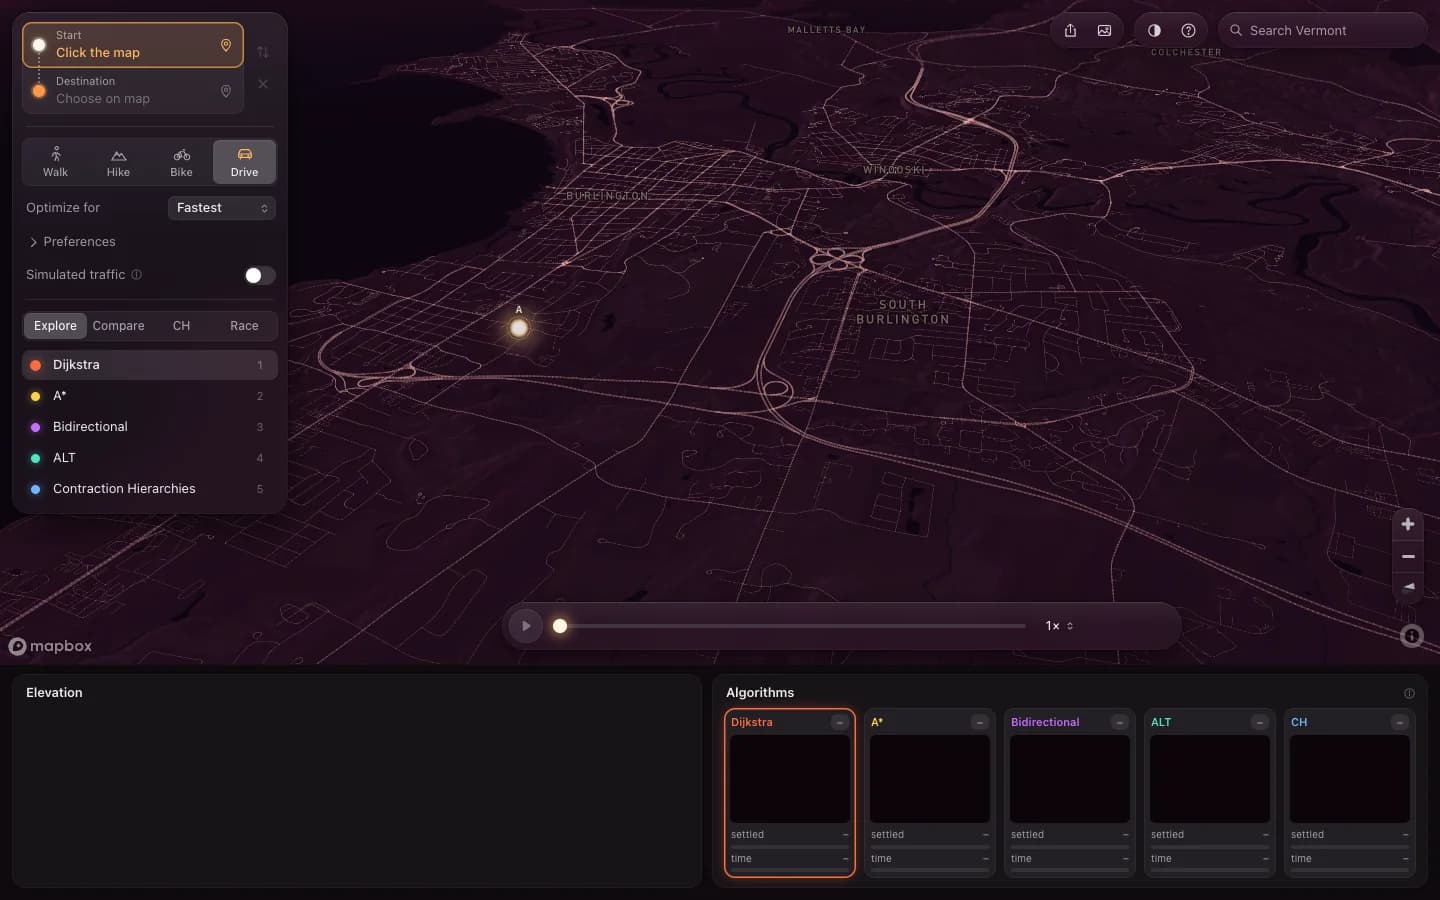
Click the map to place a start, click again for a destination. The timeline under it replays the search; Race runs all five at once.
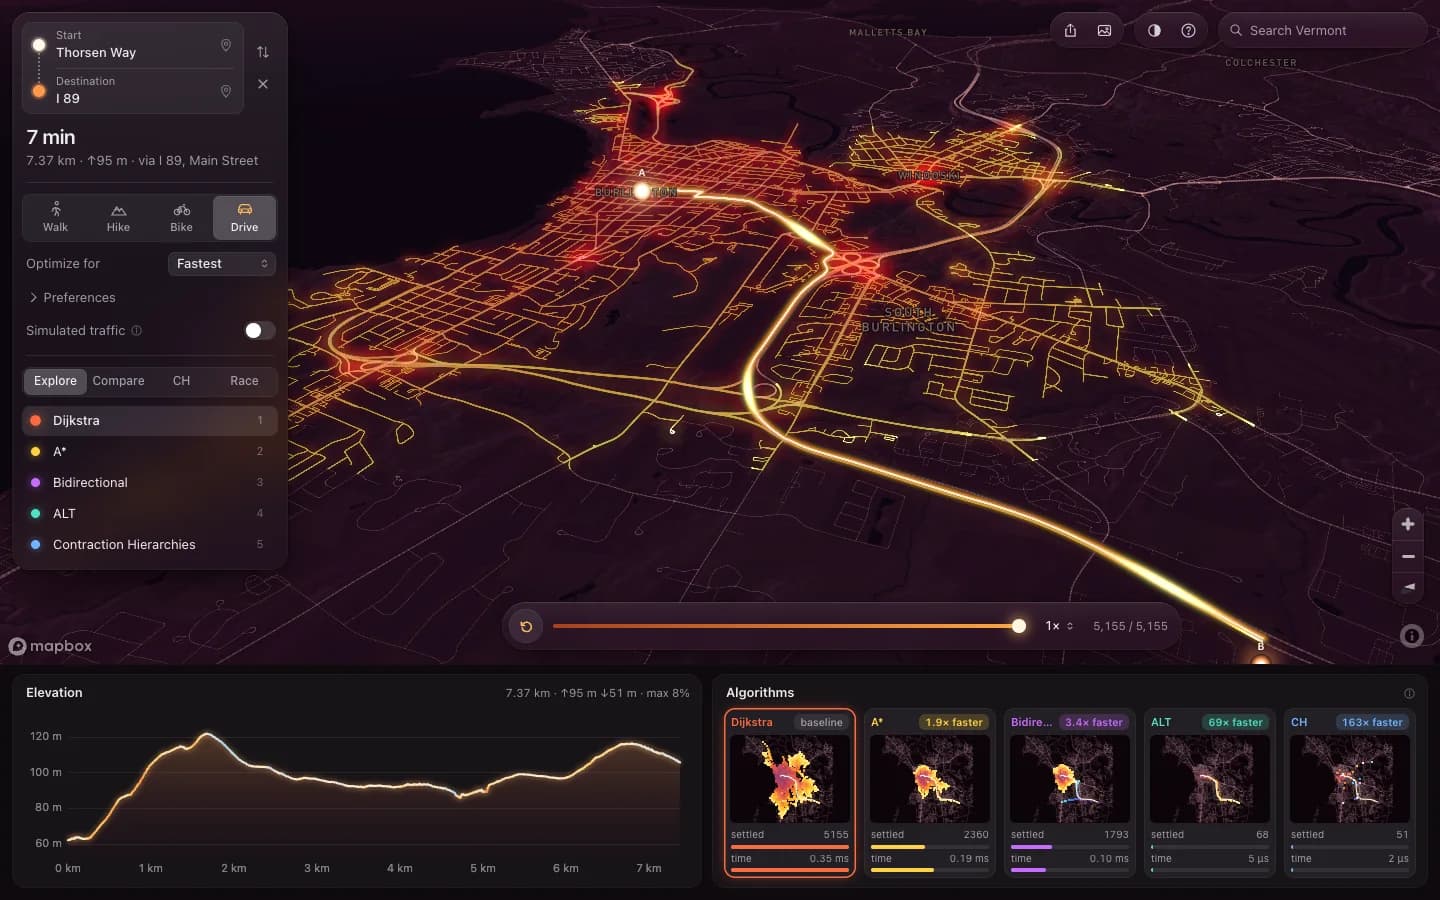
Loads the statewide overview first, then detail tiles near the camera.
FEATURE BY FEATURE
What Pathfinder 3D actually does
01
Five searches, one query, one clock
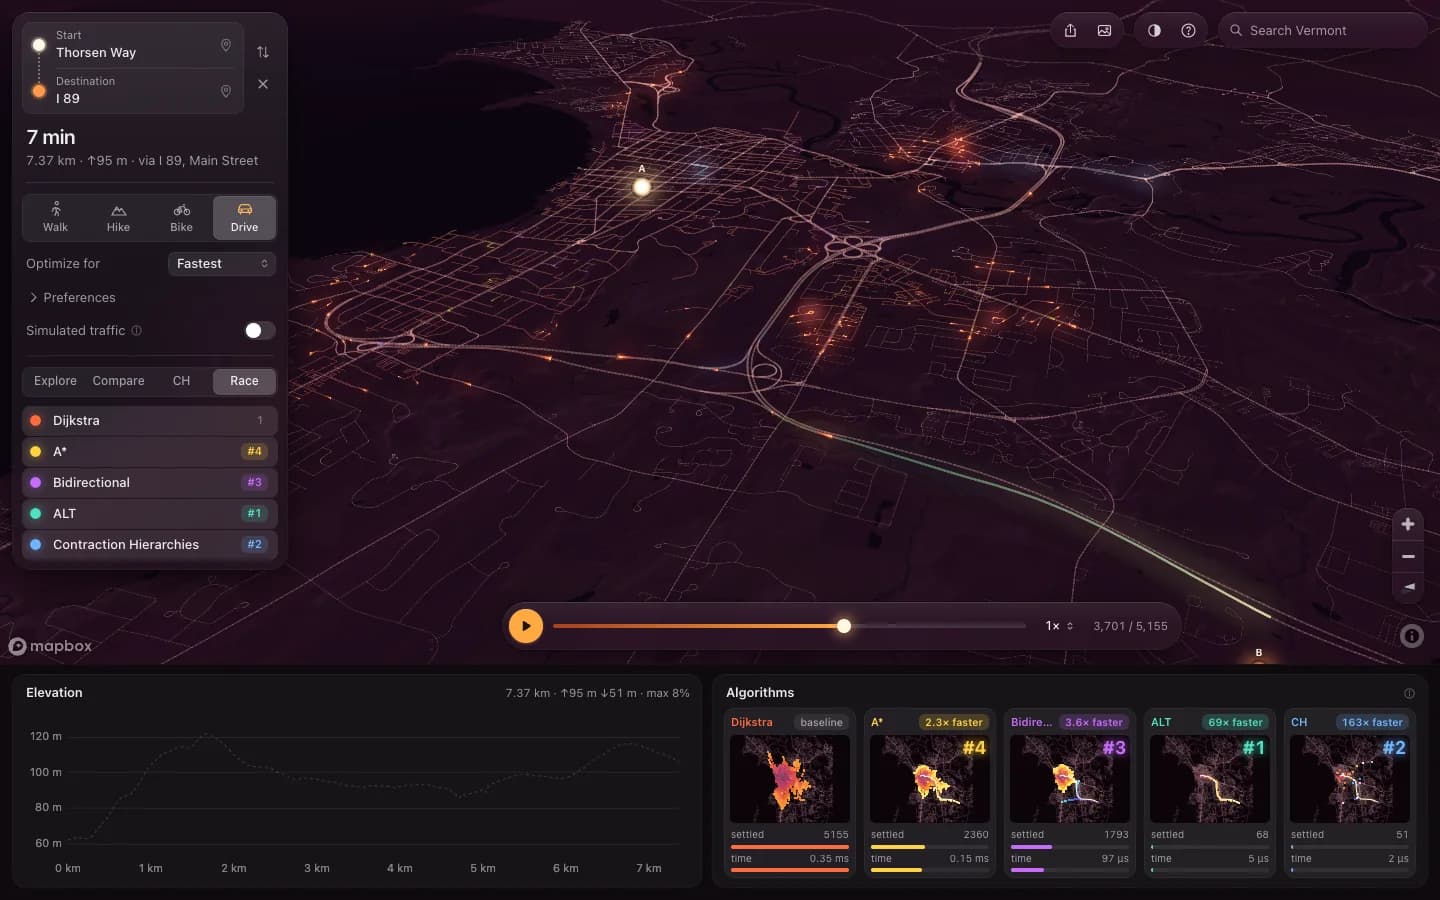
Race runs all five algorithms on the same start and destination against a single work clock, so the finishing order is the real one. The strip underneath keeps every run’s settled count and wall time, which is where the preprocessing algorithms stop being an abstract idea.
BUILT WITH
Each algorithm reports settled nodes and elapsed time from inside the wasm, and the two workers hand back lit chains keyed by global id. The page scatters those into textures and never recomputes a trace on the main thread.
02
Contraction Hierarchies, and what it costs to be that fast
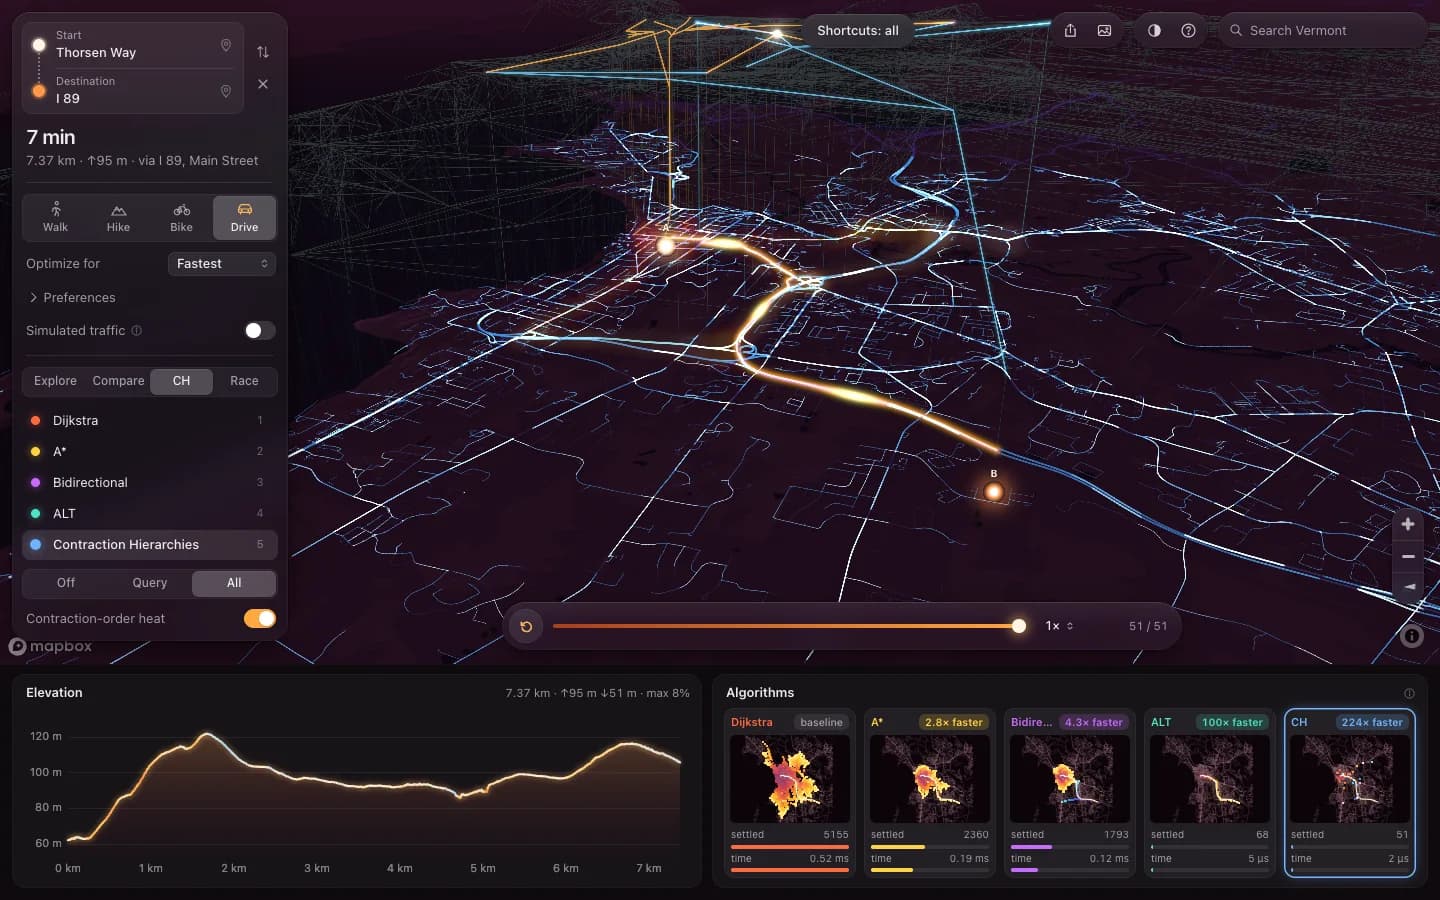
CH answers a 245 km query in about four microseconds by settling 63 nodes, against Dijkstra’s 56,000. The view lifts each upward search by node rank, so the two halves climbing the hierarchy and meeting in the middle is a thing you watch rather than a thing you are told.
BUILT WITH
Contraction runs in its own worker so it never delays the four algorithms that need no preprocessing, and the hierarchy is cached per tile set and objective. Building it for that corridor takes 367 ms, which the readout shows next to the query time rather than leaving out.
03
A real climb, not a demo route
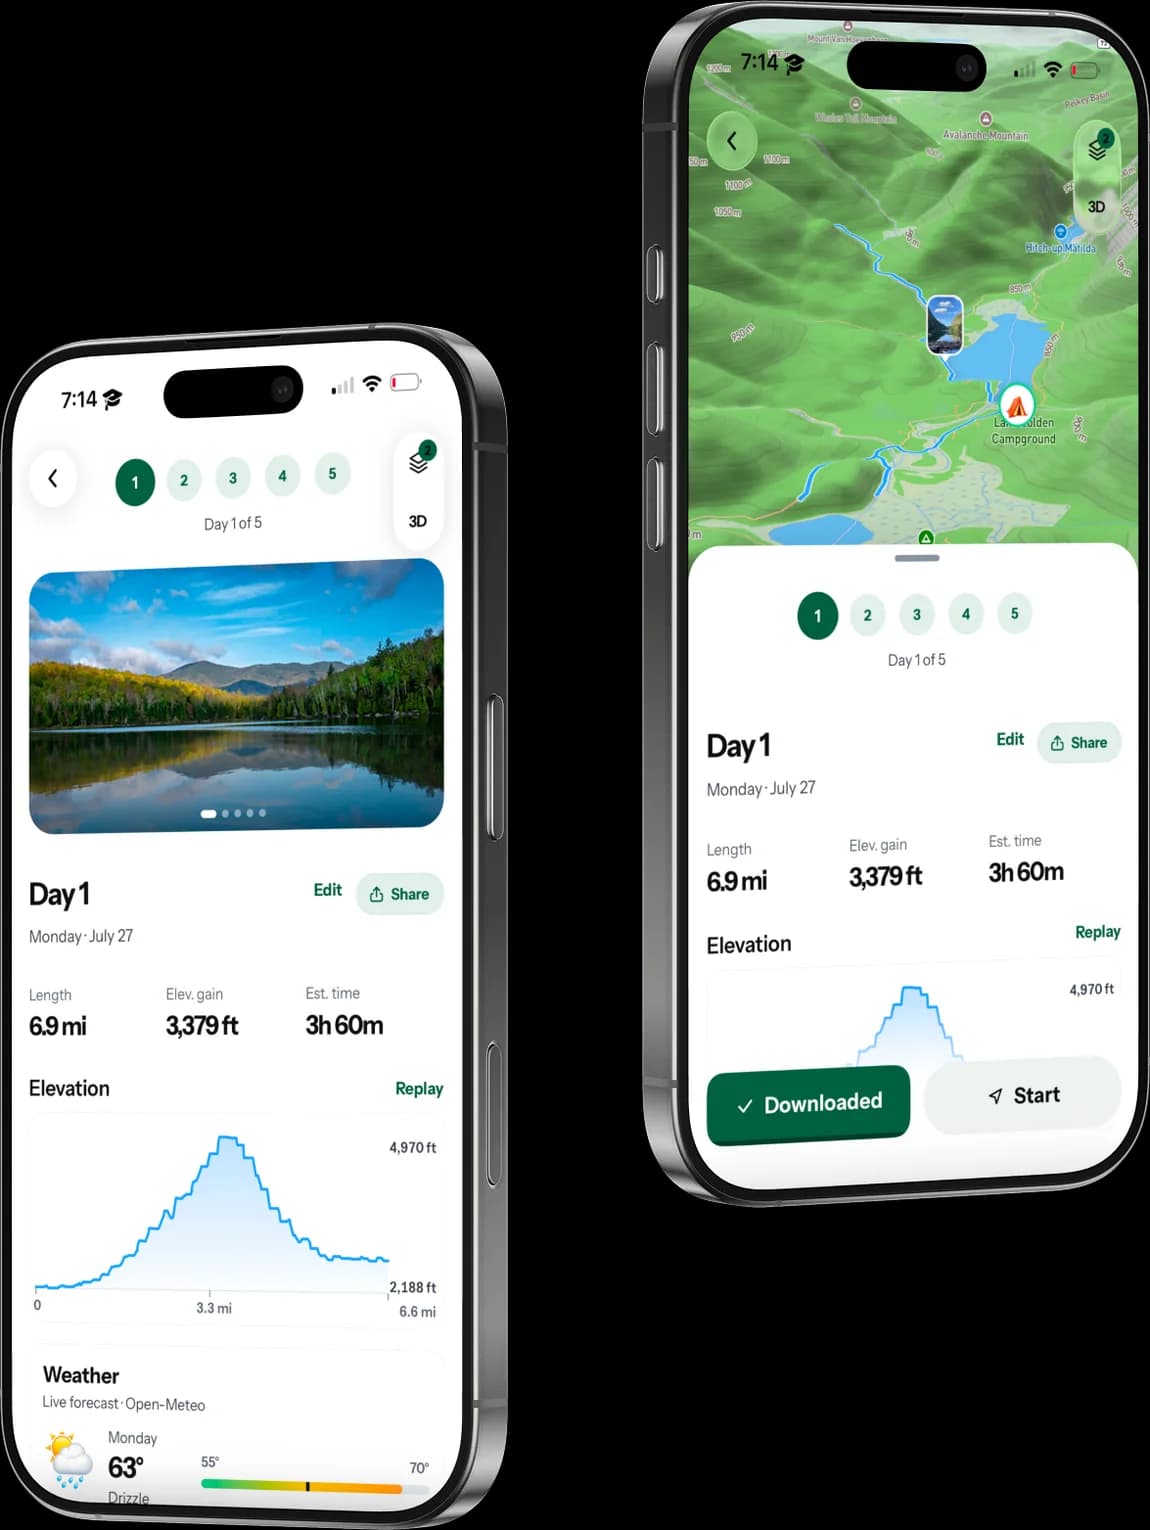
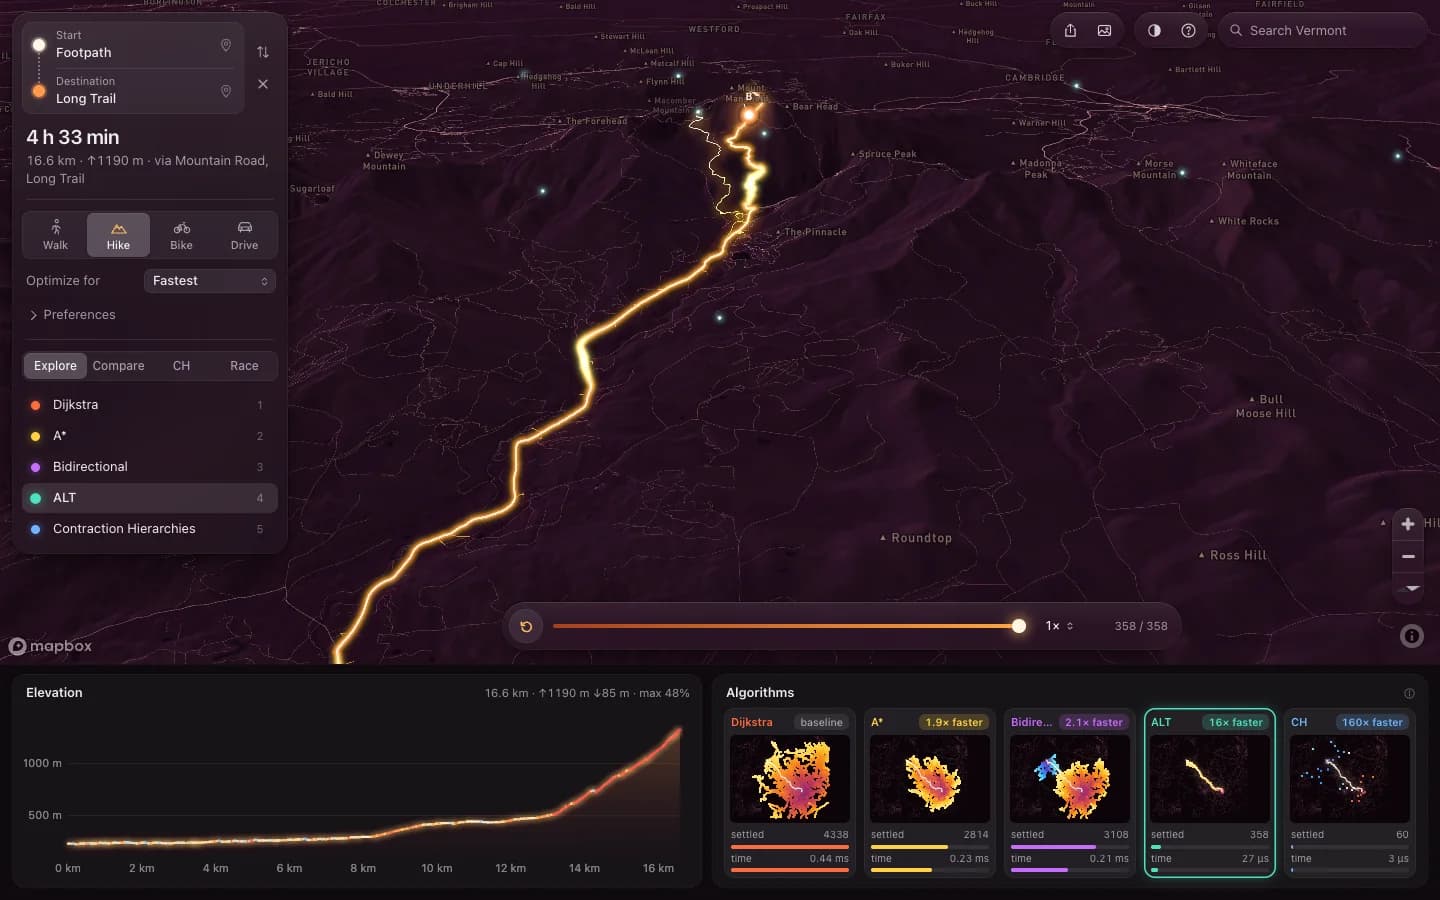
Switching to Hike opens the Long Trail from Barnes Camp on Route 108 to the Chin, the summit of Mt Mansfield: 3.6 km and 842 m up. Least climbing and Gentlest grades return genuinely different lines there, which they never do on a city grid.
BUILT WITH
Walking and hiking speeds come from Tobler’s function on the class-smoothed elevation profile, with walkers slowed off pavement. The climb’s tiles are prefetched while the app is idle, so the switch is immediate and pins already on the mountain stay where they are.
04
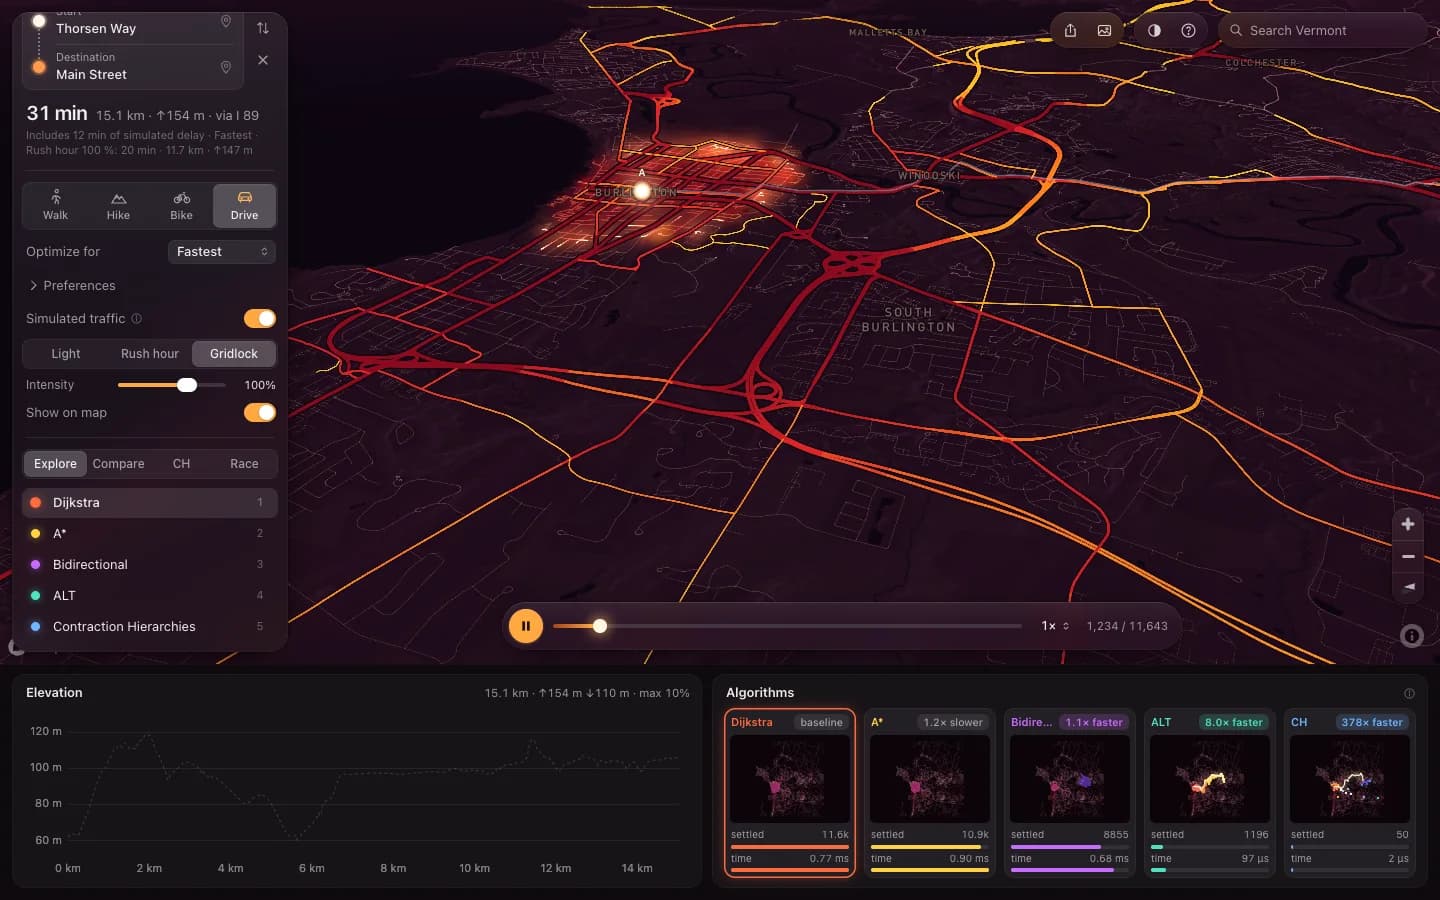
Gridlock you can route around
Driving adds Light, Rush hour and Gridlock with an intensity slider, and an overlay drawing congested roads from yellow to red. Turn it up and the fastest route leaves the arterial, which is the behaviour the Avoid traffic objective exists for.
BUILT WITH
A volume over capacity ratio built from scenario level, class demand, urban density and a smooth noise field, then a travel-time multiplier clamped to a factor of six. It only ever slows roads down, which is what keeps the free-flow speed bound valid for A*.
01Showing the search, not just the answer
The interesting part of routing is the part every map app throws away. One query is three microseconds for one algorithm and ten milliseconds for another, and the whole difference is how much of the map each had to look at before it could be sure. That is invisible in a blue line.
So the explored set is the thing on screen. It lights up as a wavefront over the terrain, with a timeline under it that plays, scrubs and replays, and a strip along the bottom that runs all five algorithms on the same query and shows settled nodes and wall time side by side. That strip is the comparison a textbook asks you to take on faith.
Compare mode splits two algorithms with a swipe divider. Race runs all five on one work clock, so the order they finish in is the order they really finish in. Contraction Hierarchies is usually done before the others have left town, which is a more convincing argument for preprocessing than any table of complexities.
02Every algorithm from scratch, and nothing underneath them
Dijkstra, A*, bidirectional Dijkstra, ALT and Contraction Hierarchies are Rust, compiled to wasm32-unknown-unknown with plain extern "C" exports. No wasm-bindgen, no routing crate, no graph crate, and the binary heap is in the repository too. The point of the project is to have written the things it draws.
That constraint keeps the boundary honest as a side effect. With no generated glue there is nothing to hide behind: the ABI is a short list of exported functions over one linear memory, written down in a contract document and tested from both sides. The Rust core and the TypeScript wrapper were built against that document rather than against each other, by two agents in separate worktrees, then reviewed and merged.
Correctness is checked by agreement rather than by eye. Nineteen Rust tests run every algorithm against an all-pairs oracle on random graphs and against Dijkstra on the real regions, two thousand pairs per region per cost model. The heuristic gets its own suite: 602,000 bound checks against Floyd-Warshall and exact consistency on 539,000 edges. In the browser all five must return the same cost on every query, and the unit tests, the end-to-end tests and the running app each check that they do.
03The whole state, cut into 599 tiles
A hand-written PBF reader takes the 46 MB Geofabrik extract of Vermont, decodes protobuf varints, zlib blobs and dense nodes, and turns 110,746 routable ways into a graph of 222,335 nodes and 259,477 chains over 46,329 km. Graph nodes are intersections, dead ends and attribute changes, plus split points that cap every chain at 400 m, so a dropped pin is never far from one.
Those chains go into 590 detail tiles at zoom 12 and 9 overview tiles at zoom 8: 27.5 MB gzipped in total, median detail tile 33 kB. Ids are global and fixed for a data version, and a chain belongs to the tile holding its half-length point, which also carries copies of its end nodes. Tiles stitch by merging ids rather than by matching coordinates within a tolerance, and the validator checks that every shared node is bit-identical in every tile that holds it. A geometric tolerance would have been easier and would have quietly welded two roads together somewhere in the state.
Elevation comes from Terrain-RGB at zoom 12, sampled bilinearly along shapes densified to 25 m, with bridges and tunnels interpolated rather than read off the ground under them. Slope runs on a profile smoothed by road class, 90 m windows on major roads that sit in cuts and on fills a 14 m model cannot see, 30 m on trails. The stored ascent is never below the net rise between two node elevations, and that inequality is not tidiness: the climb half of the A* bound is derived from it.
04What you route on is not what you can see
The camera and the query want different data, and conflating the two is how a map ends up refusing to route somewhere you are looking at. What gets drawn follows the camera: the overview everywhere, detail within a radius that grows with zoom, nearest first, at most six fetches in flight and aborted the moment they stop being wanted.
What gets routed on follows the query instead. Any path from start to destination no longer than L lies inside the ellipse where the distances to the two ends sum to L, so the query graph is the set of detail tiles that can touch that ellipse, with L set to 1.3 times the straight-line distance plus 3 km. Past a cap of 72 tiles the overview supplies major roads between the two detailed ends, and the summary says so rather than quietly returning a worse answer.
Two workers receive the same tiles and assemble identical graphs. One runs Dijkstra, A*, bidirectional and ALT; the other contracts the hierarchy and queries it, so a slow contraction never holds up the four that are ready. Every query carries an id and a newer one cancels an older one at its next step, timing runs included, so clicking quickly never leaves half a search on screen.
05Why A* is allowed to cut the corner
A* is only correct while its heuristic never overestimates, and the moment the cost stops being travel time that stops being obvious. With six weighted factors behind one goal slider, the bound has to be derived for the combination rather than assumed from the familiar case.
Each factor gets its own lower bound of the form "at least a per metre of straight line, plus b per metre of climb", and the weighted sum of those gives the two coefficients A* uses. Distance contributes 1 per metre. Climb contributes 1 per metre, which is exactly what the stored-ascent inequality buys. Tobler's hiking function yields its pair from exp(3.5·|s + 0.05|) being at least 1 + 3.5·max(0, s). Steepness, busy roads and traffic delay have no positive lower bound at all, so an objective built only from those gets a zero heuristic, and the tooltip says so instead of implying the search is being clever.
Then the data disagrees with the derivation in two small ways. Lengths are true ground lengths while the heuristic measures a straight line in one equirectangular plane for the state, which runs up to 2 per cent long in the north, and the pipeline rounds lengths down while rounding times and ascents up. So instead of trusting the proof, the assembler checks the bound on every edge of every query graph and scales both coefficients down if a single edge violates it. On the Burlington to Brattleboro corridor it settles at 0.995.
The payoff is modest and worth having. On the Mt Mansfield climb A* settles about two thirds of Dijkstra's nodes where the plain straight-line bound settled four fifths. Driving barely improves, because a straight line at the speed limit is a weak thing to know, and the readout says that rather than letting the smaller number imply otherwise.
06Finding the frame budget by measuring, not guessing
The first version played a finished search back at 22 fps with 103 ms of main-thread long tasks, and not one of the three real causes was the one I would have named. A script serves two builds side by side, alternates runs and takes medians, so the comparison survives a laptop that throttles halfway through.
The largest single cost was a call to getImageData on a GPU canvas in the mini-map strip: about 590 ms every time a replay or an algorithm switch touched it. Those pixels now live in CPU ImageData reset from a cached background. The next was fill rate. The wide additive haze quad behind every lit segment was roughly 50 device pixels across, which on a finished statewide search is on the order of a billion blended pixels per frame, and it rendered at 12 fps. Accumulating it at quarter resolution in a half-float buffer draws the same scene at 60, and rounding each contribution to 8-bit steps reproduces the old deep red bloom exactly rather than approximately.
The third was invisible from the code. Reading COLOR_CLEAR_VALUE so it can be restored after the haze pass is a synchronous GPU round trip, and switching to clearBufferfv, which leaves nothing to restore, took the layer's CPU cost while panning from 4.4 ms a frame to 0.3. Playback went from 22.1 fps to 37.4, algorithm switching from 963 ms of long tasks to none, and GPU time in race mode from 18.1 ms a frame to 7.0.
What is left is 126 ms of long tasks spread across a pan and zoom phase while tiles stream in, worst case 67 ms in one. I did not attribute it further. A street-label layer I tried cost a one-time 425 ms stall on first zoom and was dropped rather than kept and explained away.
07What it does not do
Coverage is Vermont, plus whatever the extract carries of complete ways into New York, New Hampshire, Massachusetts and Quebec. The pipeline takes any Geofabrik extract and the frontend needs no change for a larger area, but nothing larger has been built, so nothing larger is claimed.
The traffic is simulated. It is a deterministic scenario model with a named scenario, an intensity and a congestion overlay, and the word simulated sits next to it everywhere it appears, because a map that looks like this is exactly the kind a reader assumes has a live feed behind it. There is no feed.
There are no turn costs and no turn restrictions, so two algorithms can return different equal-cost paths through the same junction while agreeing to the centisecond on what it costs. Elevation is a 14 m model, so roads in cuts and on fills can still show grades they do not have, and Tobler's function knows nothing about trail difficulty, snow or scrambling. A hiking time on the Long Trail is a model output, not a plan for a day.
Long routes past the 72 tile corridor cap run on major roads in the middle, and the summary says which ones did. Driving routes are rarely certified optimal, because the straight-line bound is too weak to close the certificate, and the readout reports that per query.
08Built with
- Rust
- WebAssembly
- TypeScript
- WebGL2
- Web Workers
- Mapbox GL JS
- OpenStreetMap
- Vite
- Node.js
- Playwright
- Vercel